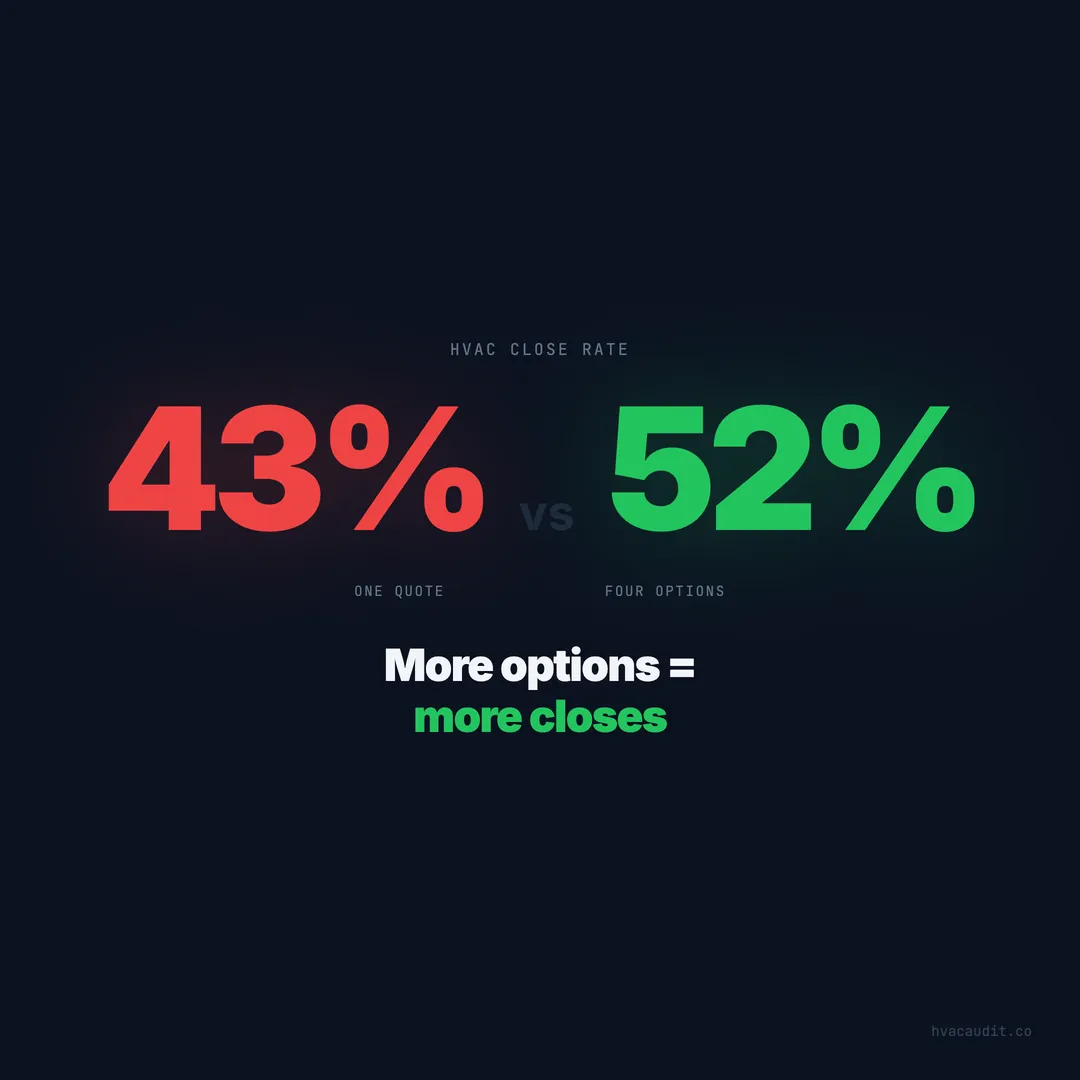
One Quote Gets 43% Close Rate — Four Options Gets 52%
HVAC contractors who present a single quote close at 43%. Those who present four or more options close at 52% — and premium equipment share jumps from 26% to 42%. Here's the data behind multi-option proposals.
A homeowner just sat through a 45-minute in-home consultation. Your tech explained everything — the compressor issue, the age of the unit, the R-22 phaseout. Then he handed over one number on a clipboard: $9,400 for a new system. The homeowner smiled, said “let me think about it,” and never called back.
That scenario repeats itself thousands of times per day across the HVAC industry. The close rate on single-quote proposals sits at just 43% according to the ACCA Contractor of the Future Study surveying over 1,000 contractors. Nearly six out of ten homeowners walk away from a single number — not because the price is wrong, but because they had no frame of reference.
Meanwhile, the contractor across town presents four options — good, better, best, and premium — and closes at 52%. Same neighborhood. Same equipment brands. Same labor rates. The only difference is how the price is framed.
Single-option proposals trigger comparison shopping
When a homeowner receives one quote, their brain does something predictable. It searches for a second number to compare it against. Since you didn’t provide one, they call your competitor to get it.
57% of homeowners get two or more quotes before committing to an HVAC purchase. That stat alone should concern any contractor relying on single proposals. You’re not losing to price — you’re losing to the absence of context.
When we audited 147 HVAC websites, we noticed a pattern. The highest-converting companies gave homeowners choices on the website itself — equipment tiers, pricing ranges, and comparison tables. The lowest-converting sites showed a single “call for a quote” button and nothing else.
The psychology is simple. A homeowner who sees four options from you doesn’t need four options from someone else. You’ve already created the comparison framework internally. Their decision shifts from “your company vs. another company” to “which of your packages fits my budget.”
The premium shift nobody expects
Here’s where the data gets interesting. Contractors who present a single quote see only 26% of their sales land on premium equipment. Contractors who present four or more options see that premium share jump to 42% — a 62% increase.
That contradicts every instinct most owners have. The assumption is: “If I show the expensive option, they’ll feel like I’m upselling.” The reality is: if you don’t show the expensive option, they can’t choose it.
The average premium HVAC system generates $3,200-$4,800 more profit per install than a base-tier unit. At 42% premium share vs. 26%, a company running 120 installs per year would see an additional $76,800-$115,200 in annual profit just from the mix shift — without closing a single additional job.
This is why pricing transparency isn’t just an ethical choice. It’s a financial one.
The four-option framework that closes at 52%
The ACCA data points to a specific structure that outperforms everything else. It’s not random bundles. It’s a logical progression where each tier adds clear, explainable value.
Tier 1 — Good (economy). This is the minimum code-compliant solution. Base SEER2 equipment, standard warranty, no extras. It exists so the homeowner has a floor. Roughly 18% of buyers choose this option.
Tier 2 — Better (mid-range). Higher efficiency, better warranty, maybe a smart thermostat included. This is the anchor — the option most contractors want to sell. About 32% of buyers land here.
Tier 3 — Best (high-efficiency). Top-tier equipment, extended warranty, indoor air quality add-on. This is the sweet spot between value and performance. Approximately 28% of buyers select this tier.
Tier 4 — Premium (complete solution). Variable-speed system, whole-home air purification, ductwork modification, 10-year parts and labor warranty. This is the option most contractors are afraid to show. 22% of buyers choose it when it’s presented. When it’s not presented, that number drops to near zero.
The key insight: each tier isn’t just more expensive. Each tier solves a different problem. Good solves “my AC is broken.” Premium solves “I want the best indoor comfort system money can buy.”
Why the close-rate jump happens
The 9-point jump from 43% to 52% isn’t magic. It’s anchoring bias at work.
When a homeowner sees a $14,000 premium option first, the $9,400 mid-range option feels reasonable by comparison. Without that anchor, $9,400 feels expensive in isolation. Behavioral economists have documented this effect across 200+ pricing studies — people evaluate prices relative to nearby alternatives, not in absolute terms.
There’s a second mechanism at play: autonomy. Giving someone four choices makes them feel in control. A single take-it-or-leave-it number feels like pressure. Research from the Journal of Consumer Psychology shows that perceived choice increases purchase likelihood by 15-23%, even when the options are functionally similar.
The combination of anchoring and autonomy is why multi-option proposals outperform across virtually every home services category — not just HVAC.
Most contractors present options wrong
Even contractors who do present multiple options often undercut themselves. The three most common mistakes we see when auditing how homeowners choose HVAC contractors:
Mistake 1: Leading with the cheapest option. When the first number a homeowner sees is $6,500, every subsequent option feels like an upsell. Present top-down — start with premium, work down to economy. Contractors who present top-down see 31% higher average ticket than those who present bottom-up.
Mistake 2: Not explaining the value gap between tiers. A homeowner looking at $6,500 vs. $9,400 vs. $12,000 vs. $14,000 sees random numbers. A homeowner looking at “14 SEER / 18 SEER / 20 SEER / variable speed” with energy savings calculated for each tier sees a return on investment. Energy cost difference between a 14 SEER and a 20 SEER system is $400-$800 per year in most climates.
Mistake 3: Presenting options on paper only. In 2026, a paper proposal feels outdated. Digital proposals with visual comparisons close 18% higher than paper equivalents. Tablets, shared screens, or emailed interactive quotes let homeowners zoom in, compare features side by side, and share with a spouse — all things a paper clipboard can’t do.
The revenue math on switching to four options
Let’s run the numbers for a company doing 150 installations per year at a $9,000 average ticket with a 43% close rate.
Current state (single quote):
- Proposals given: 349 (to get 150 closes at 43%)
- Revenue: 150 × $9,000 = $1,350,000
- Premium installs (26%): 39 jobs
Four-option state (52% close rate):
- Same 349 proposals now yield: 181 closes
- Premium share jumps to 42%: 76 premium jobs
- Average ticket rises to ~$10,200 (mix shift)
- Revenue: 181 × $10,200 = $1,846,200
That’s a $496,200 revenue increase — a 37% jump — from the same number of proposals. No additional marketing spend. No new leads. Just a different way of presenting the same information.
Even conservatively, if equipment prices keep climbing and homeowners keep expecting transparency, the gap between single-quote and multi-option contractors will only widen.
The connection between website pricing and in-home close rates
Multi-option proposals don’t start in the living room. They start on your website.
When a homeowner visits your site and sees pricing ranges, equipment comparisons, and financing options, they arrive at the in-home consultation pre-educated. They already know a system costs $7,000-$15,000. They’ve already processed the sticker shock. The conversation shifts from “how much” to “which option.”
Contractors who show pricing on their websites report 22% shorter sales appointments because less time is spent justifying the price and more time is spent discussing features. The homeowner has already accepted the range — now they’re choosing within it.
This is also why your website conversion rate matters so much. A site that presents tiered options converts visitors into consultations at 3-5x the rate of a site that hides pricing. And those consultations close at higher rates because the homeowner self-selected into your price range before you showed up.
Good-better-best works for service calls too
Multi-option proposals aren’t just for installations. The same framework applies to repairs.
A tech diagnosing a failing capacitor can present three options:
| Option | What’s included | Price |
|---|---|---|
| Fix it | Replace the capacitor | $225 |
| Fix it right | Capacitor + contactor + electrical inspection | $425 |
| Prevent it | Full tune-up + capacitor + contactor + surge protector | $650 |
Repair techs who present three options see average ticket sizes increase 34%. The homeowner who came in expecting a $225 fix often chooses the $425 or $650 option — not because they were upsold, but because they saw the value in preventing the next breakdown.
This is the difference between a company that stays busy but broke and one that builds profit into every service call.
What the top 10% do differently
After analyzing hundreds of proposals across our audit data, the contractors with the highest close rates share five habits:
They present options visually. Side-by-side comparisons on a tablet or printed proposal with photos of each equipment tier. Visual proposals close 23% higher than text-only lists.
They include financing on every option. Not just the expensive ones. Showing “$139/month” next to “$12,500” on every tier makes the monthly payment the anchor instead of the total price. This connects directly to how equipment price increases are reshaping buyer behavior.
They explain the cost of doing nothing. A 15-year-old system running at 8 SEER is costing $1,200/year more in energy than a 16 SEER replacement. Over five years, that’s $6,000 — which reframes the “expensive” option as a savings decision.
They leave the proposal behind. Physical or digital, the homeowner gets to review at their own pace. Contractors who leave proposals see 14% of “think about it” responses convert within 72 hours — but only if the proposal is in the homeowner’s hands, not in the truck.
They follow up exactly once. A single follow-up call 48 hours later recovers 8-12% of undecided prospects. More than one follow-up drops the conversion rate — it feels like pressure.
The objection that doesn’t hold up
“But if I show four options, homeowners will just pick the cheapest one.”
The data says otherwise. Only 18% pick the economy tier when four options are presented. The majority — 60% — choose the middle two tiers. And 22% choose premium — a category that literally doesn’t exist when you present one quote.
You’re not losing margin by showing options. You’re losing margin by not showing them. The homeowner who picks your economy option at $6,500 was going to negotiate your single $9,400 quote down to $7,000 anyway — or they were going to call your competitor. At least now they’re closing with you, and they’re doing it without a fight.
Multi-option proposals don’t lower your average ticket. They raise it. Average ticket increases of 12-18% are typical when contractors switch from single quotes to four-tier proposals, because the mix shift toward premium more than offsets the small percentage who choose economy.
Start with the presentation, not the proposal software
You don’t need expensive proposal software to present four options. A clean one-page sheet — printed or on a tablet — with four columns works. Each column lists: equipment model, SEER rating, warranty, included add-ons, total price, and monthly payment.
The contractors closing at 52% aren’t using fancier technology. They’re using a different framework. One that gives homeowners what every buyer wants: the ability to compare, choose, and feel confident in their decision.
Your next step is simple. Take your most common installation scenario. Build four tiers. Present them top-down on your next five consultations. Track the results. The data from 1,000+ contractors says your close rate will climb and your premium share will nearly double.
The math doesn’t lie. The contractors who present one number are leaving $500,000+ per year on the table. The ones presenting four options are picking it up.
Keep reading
Want to know your score?
Drop your URL — full report in 48 hours.
We're on it.
Report in your inbox within 48 hours.