Busy But Broke: Why $598K Revenue Means $76K Take-Home
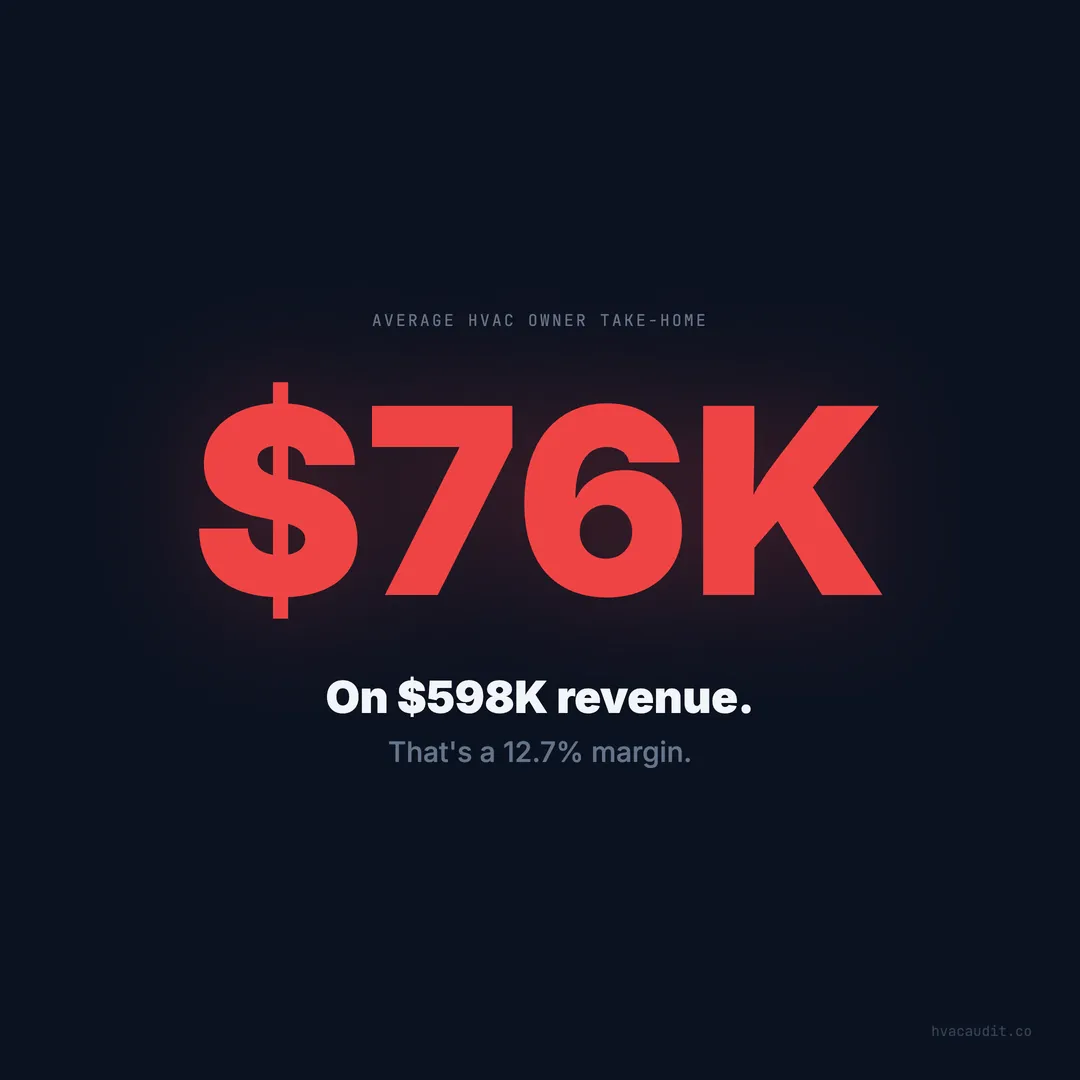
The average HVAC company does $598K in revenue and the owner takes home $76K. That's a 12.7% margin before taxes. Here's where the money actually goes — and why busy doesn't mean profitable.
The owner of a three-truck HVAC company just finished his best month ever. $87,000 in revenue. His techs ran 14-hour days. The phone didn’t stop ringing. He barely slept.
Then he looked at his bank account. After payroll, insurance, truck payments, parts, gas, marketing, software, and the emergency compressor he had to buy when a tech dropped one — he cleared $4,200. That’s a 4.8% net margin on his “best month ever.”
The average HVAC company generates $598,000 in annual revenue. The owner takes home $76,000. That’s 12.7% before taxes. After self-employment tax, health insurance, and retirement contributions, the actual take-home is closer to $52,000 — about the same as one of his own technicians makes.
This isn’t a failure story. This is the industry average.
Revenue is vanity — profit is the number that matters
Every HVAC contractor knows their revenue number. Very few know their actual net margin. The typical HVAC contractor operates on 2.5–5% net profit margins. That means for every $100 in revenue, $95–$97.50 goes back out the door.
The breakdown for a typical $598K operation looks like this:
| Category | % of revenue | Annual cost |
|---|---|---|
| Labor (techs + office) | 30–35% | $179,000–$209,000 |
| Materials and equipment | 25–30% | $150,000–$179,000 |
| Overhead (rent, insurance, vehicles) | 15–20% | $90,000–$120,000 |
| Marketing and advertising | 8–12% | $48,000–$72,000 |
| Owner compensation | 10–13% | $60,000–$78,000 |
| Net profit | 2.5–5% | $15,000–$30,000 |
That “net profit” line is what’s left after the owner pays themselves. It’s the company’s retained earnings — the money available for growth, emergencies, and slow months. Over 50% of home service businesses don’t generate meaningful profit after owner compensation. They’re jobs disguised as businesses.
The labor trap eats everything first
Labor is the largest expense in every HVAC operation, and it’s the one most owners underestimate. A single HVAC technician costs $65,000–$95,000 per year in total compensation — salary, payroll taxes, workers’ comp, health insurance, training, and vehicle costs. A three-tech company is spending $200,000–$285,000 on labor before a single part is ordered.
The problem compounds during peak season. When call volume triples in June, most owners respond by running their existing techs longer rather than hiring additional help. Overtime rates push effective labor costs up 30–50%. A tech making $30/hour costs $45/hour after 40 hours — and in peak season, most techs are running 55–65 hour weeks.
The alternative — hiring seasonal techs — creates a different cost: recruiting, background checks, training, and the risk that the new hire damages a customer relationship on day three. HVAC companies are already competing for a shrinking labor pool. There are 110,000 unfilled HVAC jobs right now, and most qualified techs are already employed.
Either way, labor costs rise faster than revenue. The owner works more, pays more overtime, and takes home less per dollar earned.
Marketing spend with no tracking is a second leak
The average HVAC company spends 8–12% of revenue on marketing. For a $598K company, that’s $48,000–$72,000 per year — a significant investment. But here’s the problem: most HVAC owners can’t tell which marketing channel generates their best leads.
When you’re spending $5,000/month on Google Ads, $1,500/month on SEO, $800/month on a lead gen platform, and $500/month on social media — and you don’t know which channel produced the 15 calls that turned into jobs this week — you’re guessing with $72,000.
The average HVAC customer acquisition cost has nearly doubled — from $242 in mid-2022 to over $400 by 2023. Contractors who don’t track their cost per lead, cost per acquisition, and customer lifetime value are spending more to acquire customers who may not be worth the investment.
The worst version of this: paying HomeAdvisor or Angi $1,400 per booked job while organic leads from a properly optimized Google Business Profile would cost a fraction of that.
Seasonal swings make thin margins dangerous
HVAC isn’t a steady business. It’s a rollercoaster. Revenue can swing from $180,000 in a peak summer month to $45,000 in a slow winter month. That’s a 75% drop — but your fixed costs don’t drop at all.
Truck payments, insurance, office rent, software subscriptions, and salaried employees cost the same in January as they do in July. The owner who clears $15,000 in profit during July might lose $8,000 in February. Over 12 months, the peaks barely cover the valleys.
91% of HVAC businesses report cash flow problems. The most common pattern: owners spend their summer profits on equipment, marketing, and hiring — then scramble for cash by October. By January, they’re floating payroll on a credit line. By March, the credit line is maxed. By the time summer revenue kicks in again, they’re spending the first two months just paying down debt.
The contractors who break this cycle do three things: they push maintenance agreements to create winter revenue, they maintain a cash reserve equal to 2–3 months of operating expenses, and they price their services to produce margins that can absorb the swing.
Pricing too low is the most expensive mistake
Most HVAC owners set prices by looking at what competitors charge and matching it — or going slightly lower to “win more work.” This is how a busy company stays broke.
The difference between a 5% net margin and a 15% net margin on $598K in revenue is $59,800. That’s an extra $59,800 in the owner’s pocket — not from working harder, not from running more calls, just from pricing correctly.
When we look at what the top 5% of HVAC companies do differently, pricing strategy is always part of the picture. They charge 15–25% more than the market average — and they get it because their websites, reviews, and trust signals justify the premium. Homeowners don’t choose the cheapest option. They choose the one that feels safest.
A contractor charging $350 for a repair that costs $280 in labor and parts makes $70 in gross profit (20%). A contractor charging $450 for the same repair makes $170 (38%). The second contractor doesn’t need to run twice as many calls to take home twice as much. They just need better positioning.
The website is part of the profit problem
Here’s where the numbers connect. The average HVAC website scores 34 out of 100 and costs its owner $4,200 per month in missed leads. That’s $50,400 per year in revenue that walked away because the website didn’t convert.
On a $598K revenue base with a 5% net margin, that missing $50,400 in revenue would have produced an additional $2,520 in pure profit — assuming the same margins. But website leads typically convert at higher margins than referral leads because the homeowner has already pre-qualified themselves by researching your pricing, reviews, and services.
The real cost is even higher. A contractor running Google Ads at a 30% waste rate on a $5,000/month budget is burning $1,500/month — $18,000/year — on clicks that go to a website that doesn’t convert. That’s money directly subtracted from an already-thin margin.
The contractors who break out of “busy but broke” don’t just work harder. They fix the leaks. Better pricing, tracked marketing spend, a website that actually converts, and maintenance agreements that smooth out seasonal swings.
The path from $76K to $150K isn’t more trucks
Most owners think growth means more trucks, more techs, more revenue. But adding a truck adds $80,000–$120,000 in annual costs. If that truck produces $200,000 in revenue at a 5% margin, it generates $10,000 in profit — barely enough to justify the risk.
The faster path: fix the margin first.
- Raise prices 10–15%. You’ll lose some price-shoppers. The remaining customers will be more profitable, and your reviews and trust signals will replace the lost volume.
- Track every marketing dollar. Kill channels that cost more than $400 per acquired customer. Double down on channels under $200.
- Fix your website. A site that answers the 7 questions homeowners ask converts 2–3x more than one that doesn’t. That’s free revenue from traffic you’re already paying for.
- Sell maintenance agreements. Recurring revenue at 60–70% margins that fills the winter cash gap.
The goal isn’t more revenue. It’s more profit per dollar of revenue. A $598K company at 15% margin takes home more than a $900K company at 5%.
Busy is not an achievement. Profitable is.
Keep reading
Want to know your score?
Drop your URL — full report in 48 hours.
We're on it.
Report in your inbox within 48 hours.